
AGENT SPECIALTY //
Observability and security
Observability Operator triages alerts, manages silences and debugs dashboards in Prometheus, Alertmanager, Grafana, Loki and OpenTelemetry, telling real problems from noise.
TICKETS FROM
ServiceNow or another ITSM
CATEGORY
Observability and security
AUTONOMY
Investigate only, with a person, or on its own
DEPLOYMENT
On-prem, cloud or hybrid
█
SPECIALTY_BRIEFING
// WHAT 2501 DOES
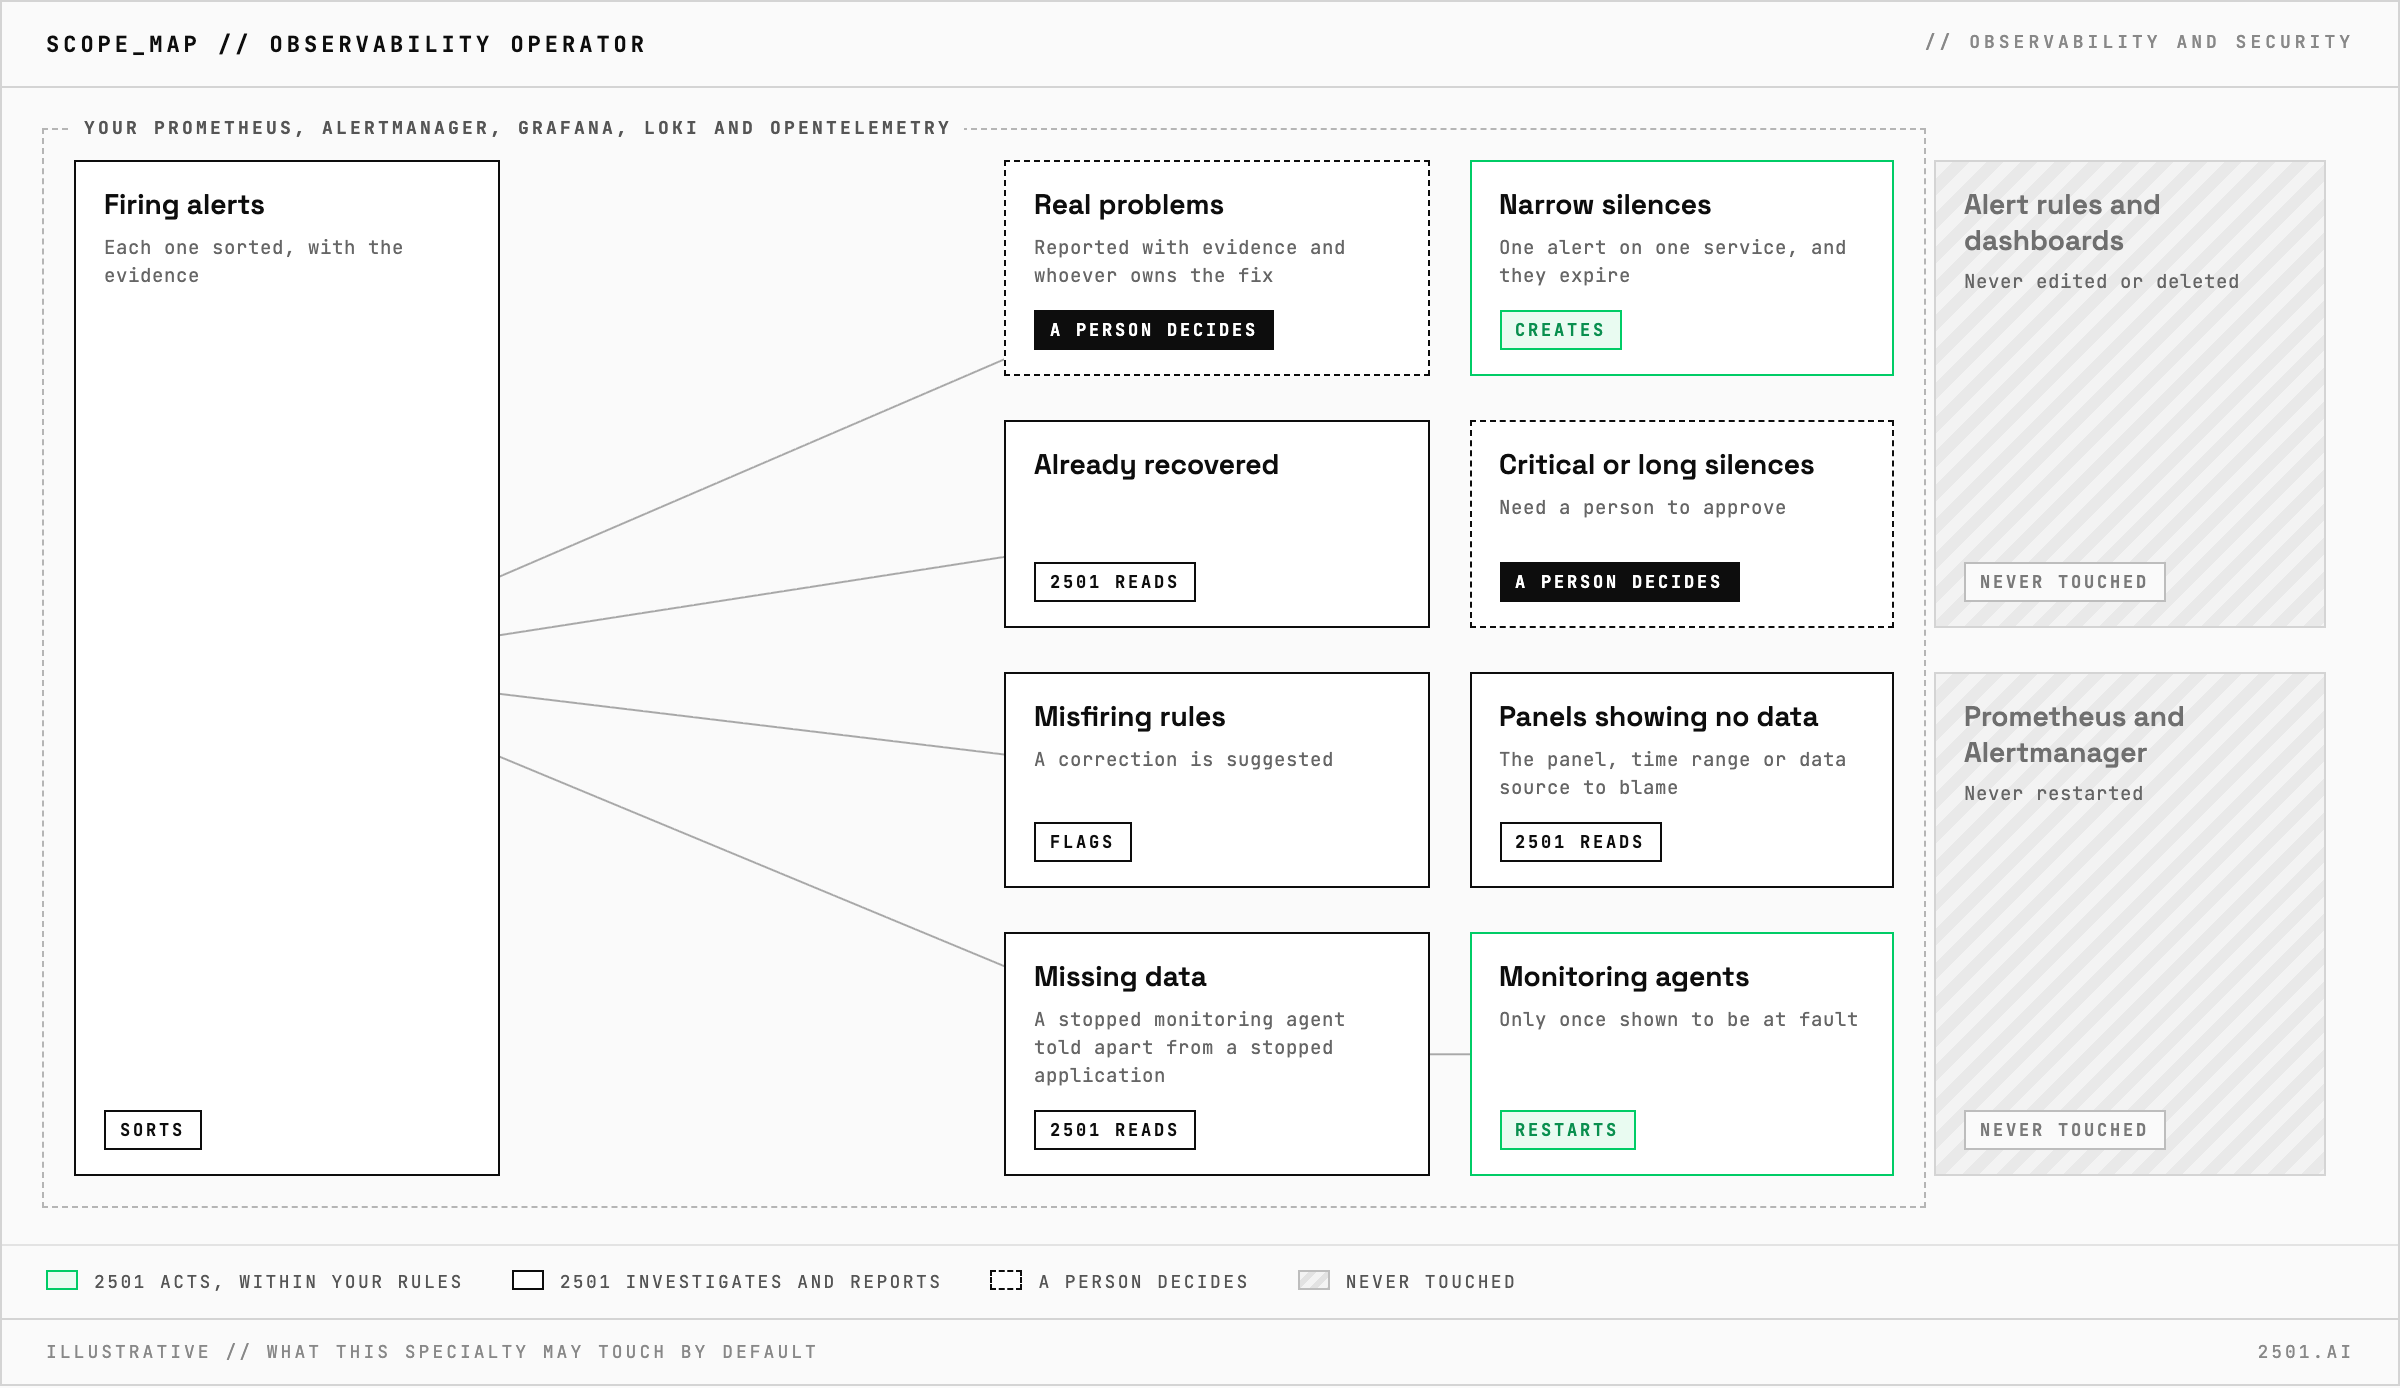
2501's Observability Operator specialty triages firing alerts, manages silences and debugs dashboards across Prometheus, Alertmanager, Grafana, Loki and OpenTelemetry. It tells real problems from noise, and leaves alert rules and dashboards to your team.
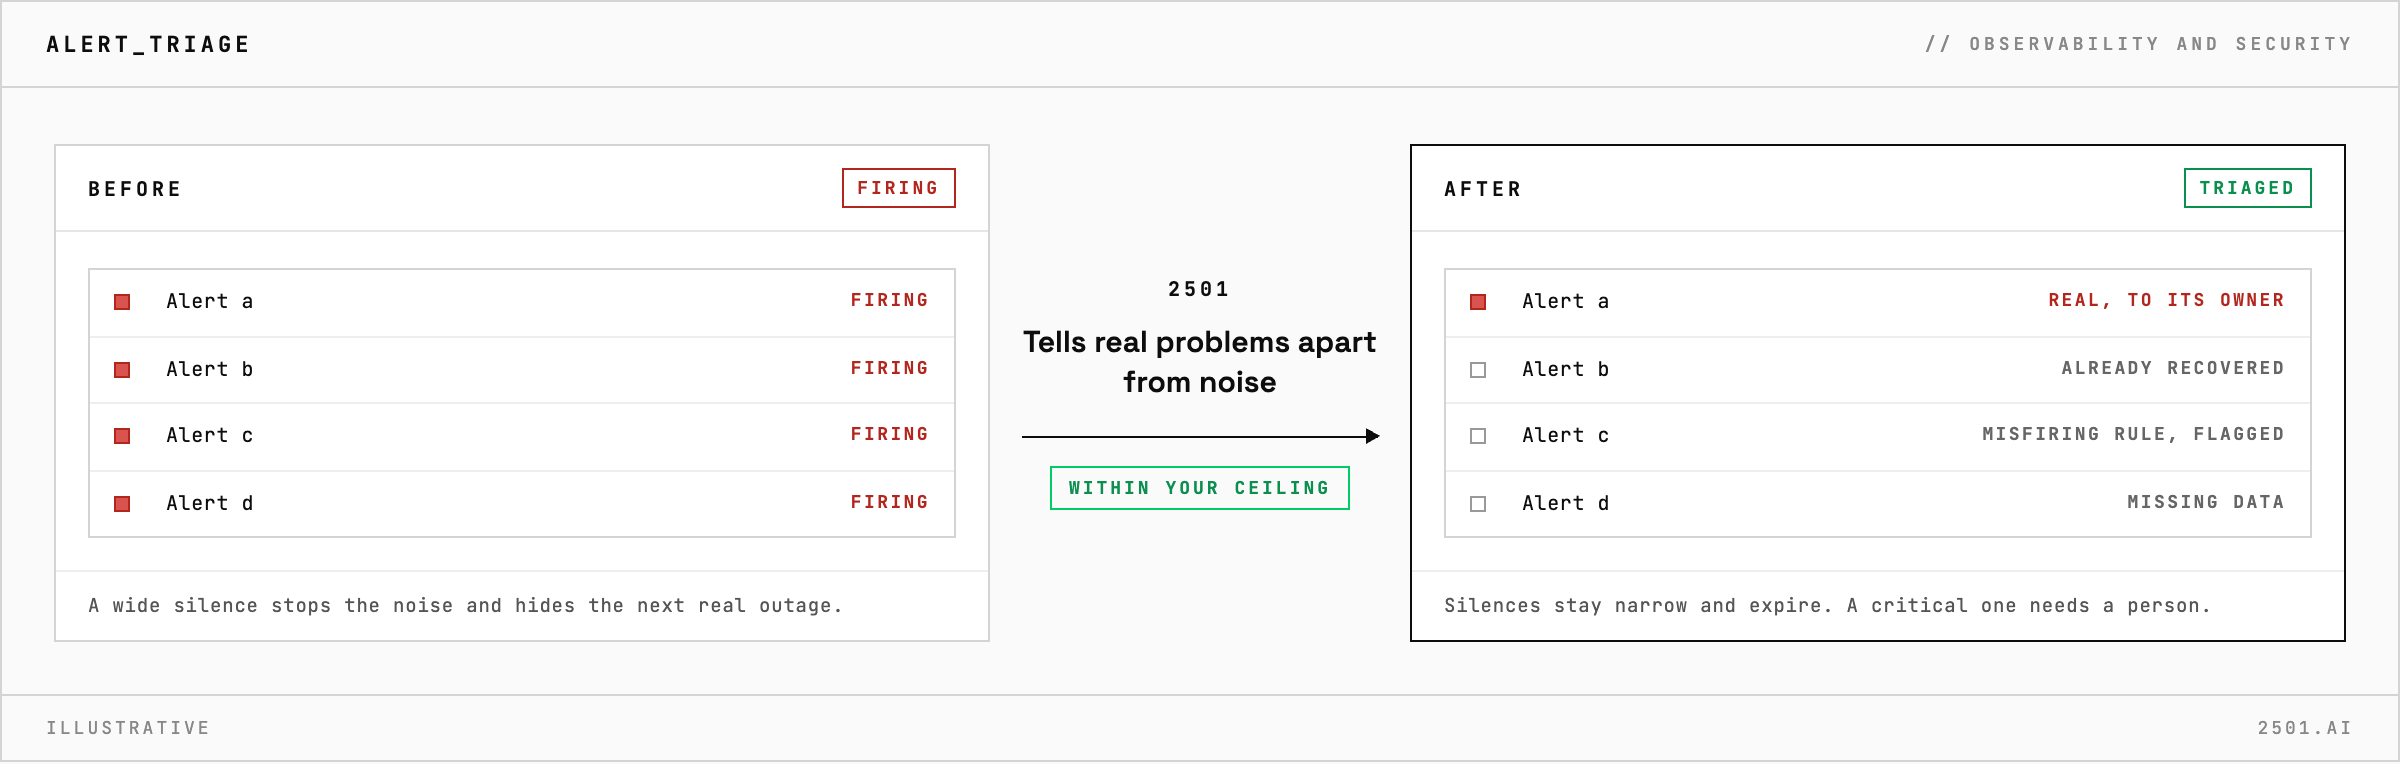
An alert that pages someone at 3am may come from a rule that misfires, a check that already recovered or a system that stopped reporting. A wide silence stops the noise and hides the next real outage.
The Observability specialty takes these requests from your ticketing system. A stopped monitoring agent and a stopped application can raise the same alert, so it tells them apart, and restarts a monitoring agent only once it is shown to be at fault. Each alert is sorted as real, already recovered, a misfiring rule or missing data. A real problem is reported with its evidence and whoever owns the fix; a misfiring rule is flagged with a suggested correction. For a panel showing no data, it finds whether the panel, the time range or the data source is to blame.
Can it fix an alert rule that misfires? It reports why the rule misfires and suggests a correction, and leaves the change to your team.
Can it triage without changing anything? Yes. In investigate-only mode it classifies each alert with the evidence, and creates no silences.
Each page is one kind of ticket, and how this specialty handles it within the limits you set.
> READY_TO_DEPLOY
Book a technical demo and walk through your own environment with the 2501 team.

